Why R
What is R?
R is an open-source object-oriented programming language with an emphasis on statistical computing, data analysis and high quality graphics. Due to R being free, it has a very broad and highly active user community on Stack Overflow and GitHub as well as many other platforms available for self-study such as YouTube and Coursera. Additionally, the functionality of the programme continues to grow with user written packages. When writing this, there were 15 396 packages available on the Comprehensive R Archive Network (CRAN) (up from 13 528 this time last year). These can be easily downloaded directly from within R by simply using the function install.packages().
Why R?
For Excel Users
R provides reproducible outputs
Research done in excel is often mutli-sheet and difficult to follow the intricate web of cell linkages. This makes the process more obscure and harder to replicate, share and collaborate with colleagues.R is highly efficient compared to spreadsheet applications
It allows for faster calculations and standardised processes. It is not uncommon to have large excel documents split into multiple sheets, have values copied over without their formulas to save computing power, or for sheets to have formulas turned on to manual to avoid crashing. None of this is necessary with R.
For Stata and Excel Users
Simpler front-end function development
Although Excel functions can be created using VBA and Stata “egen” and “cond” can substitute as low level functions, in R functions are first class objects. This means that you can do anything with a function that you can do with a vector or any other object. R functions are also extremely easy to create and execute (although this simplicity can be dangerous if users do not follow proper function protocol - which we will go through).Graphs, maps and customisability
R graphics are exceptional. They combine some of the built in simplicity of excel graphs (where the programme is making a lot of choices on the users behalf) and allow for quick and elegant graphics with complete customisability. All graphics are also treated as objects allowing for useful loops and efficent manipulations. Additionally, the outputs are easily copied and exported in multiple formats including html, jpeg, png, gif, pdf.Open-source community development
The enormous repository of community developed packages and active engagement on platforms like Stack Overflow and Github make using and learning R much easier. There are new packages released every day that cover increasingly niche problems. This cannot be replicated by paid development teams in scope or speed of delivery.Its free!
This may seem trivial at a university with plenty of software licenses floating around but allowing students to easily (and without bureaucracy or piracy) install R at home and on their laptops, frees up the limited resources of computer labs and libraries. The problem of backwards compatibility disappears as everybody can have access to the latest version. Additionally, students can always take their skills wherever they go in future without worrying about access to licences or updates.Common datasets and the capacity for multiple datasets
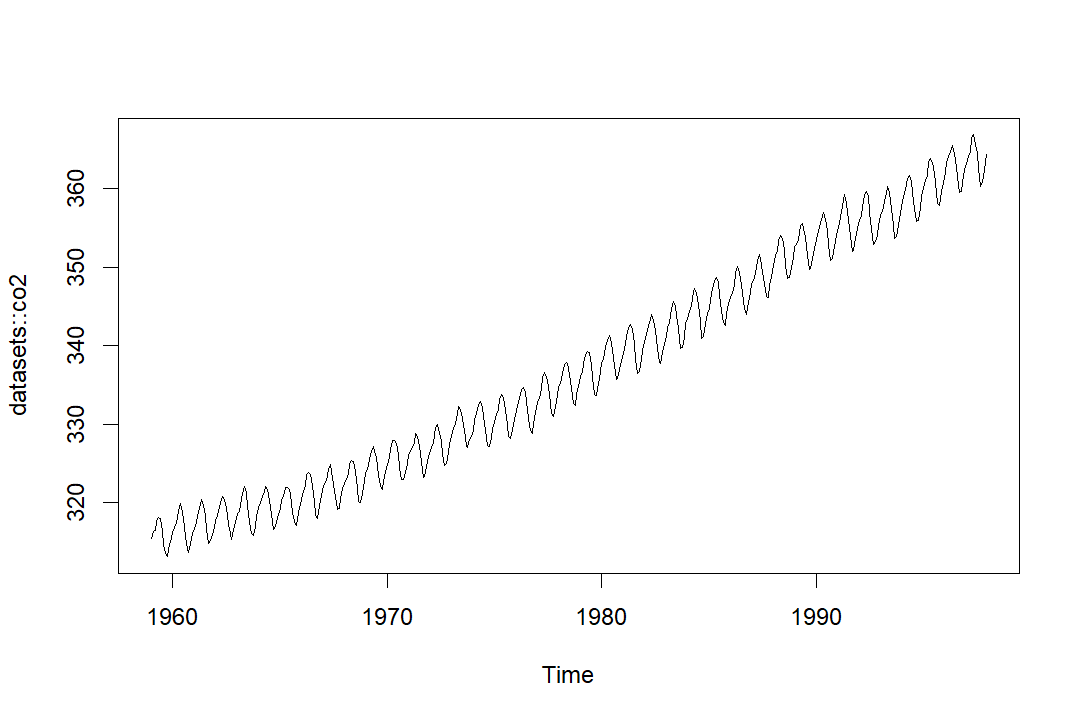
R has a large number of built in datasets from real world research including some seminal work. This allows teaching and problem solving to be done across common data without the risk of uploading sensitive information or downloading malicious files. The plot below illustrates this point. The plot shows co2 concentrations reflected in parts per million. Working on this data with your class or colleagues doesn’t require data downloads or sharing.